PROJECT INTERSECT

Transforming High Risk Areas To Improve Road Safety Across Bengaluru

170+ High Risk Zones

170+ High Risk Zones

One City. Act Now

One City. Act Now

FUND • VOTE • PRIORITISE

FUND • VOTE • PRIORITISE

ABOUT THE INTIATIVE

What is Project Intersect?

From Crash Data to Countermeasures.

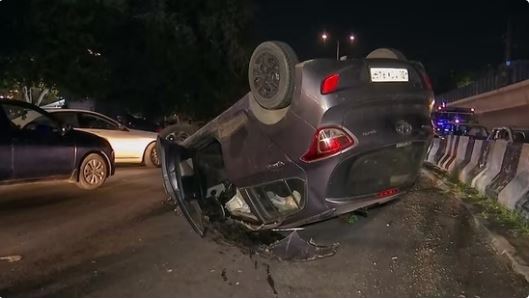
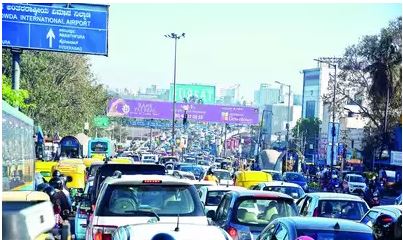
Our city's roads remain unsafe.
Bengaluru recorded 4,893 road accidents in 2025 alone.

Project Intersect, under the Greater Bengaluru Authority’s road safety initiative, enables the planning and prioritisation of road safety interventions through a data-driven approach - informed by crash data at every stage.

So what are we doing to make Bengaluru’s roads safer?
IDENTIFIED LOCATIONS

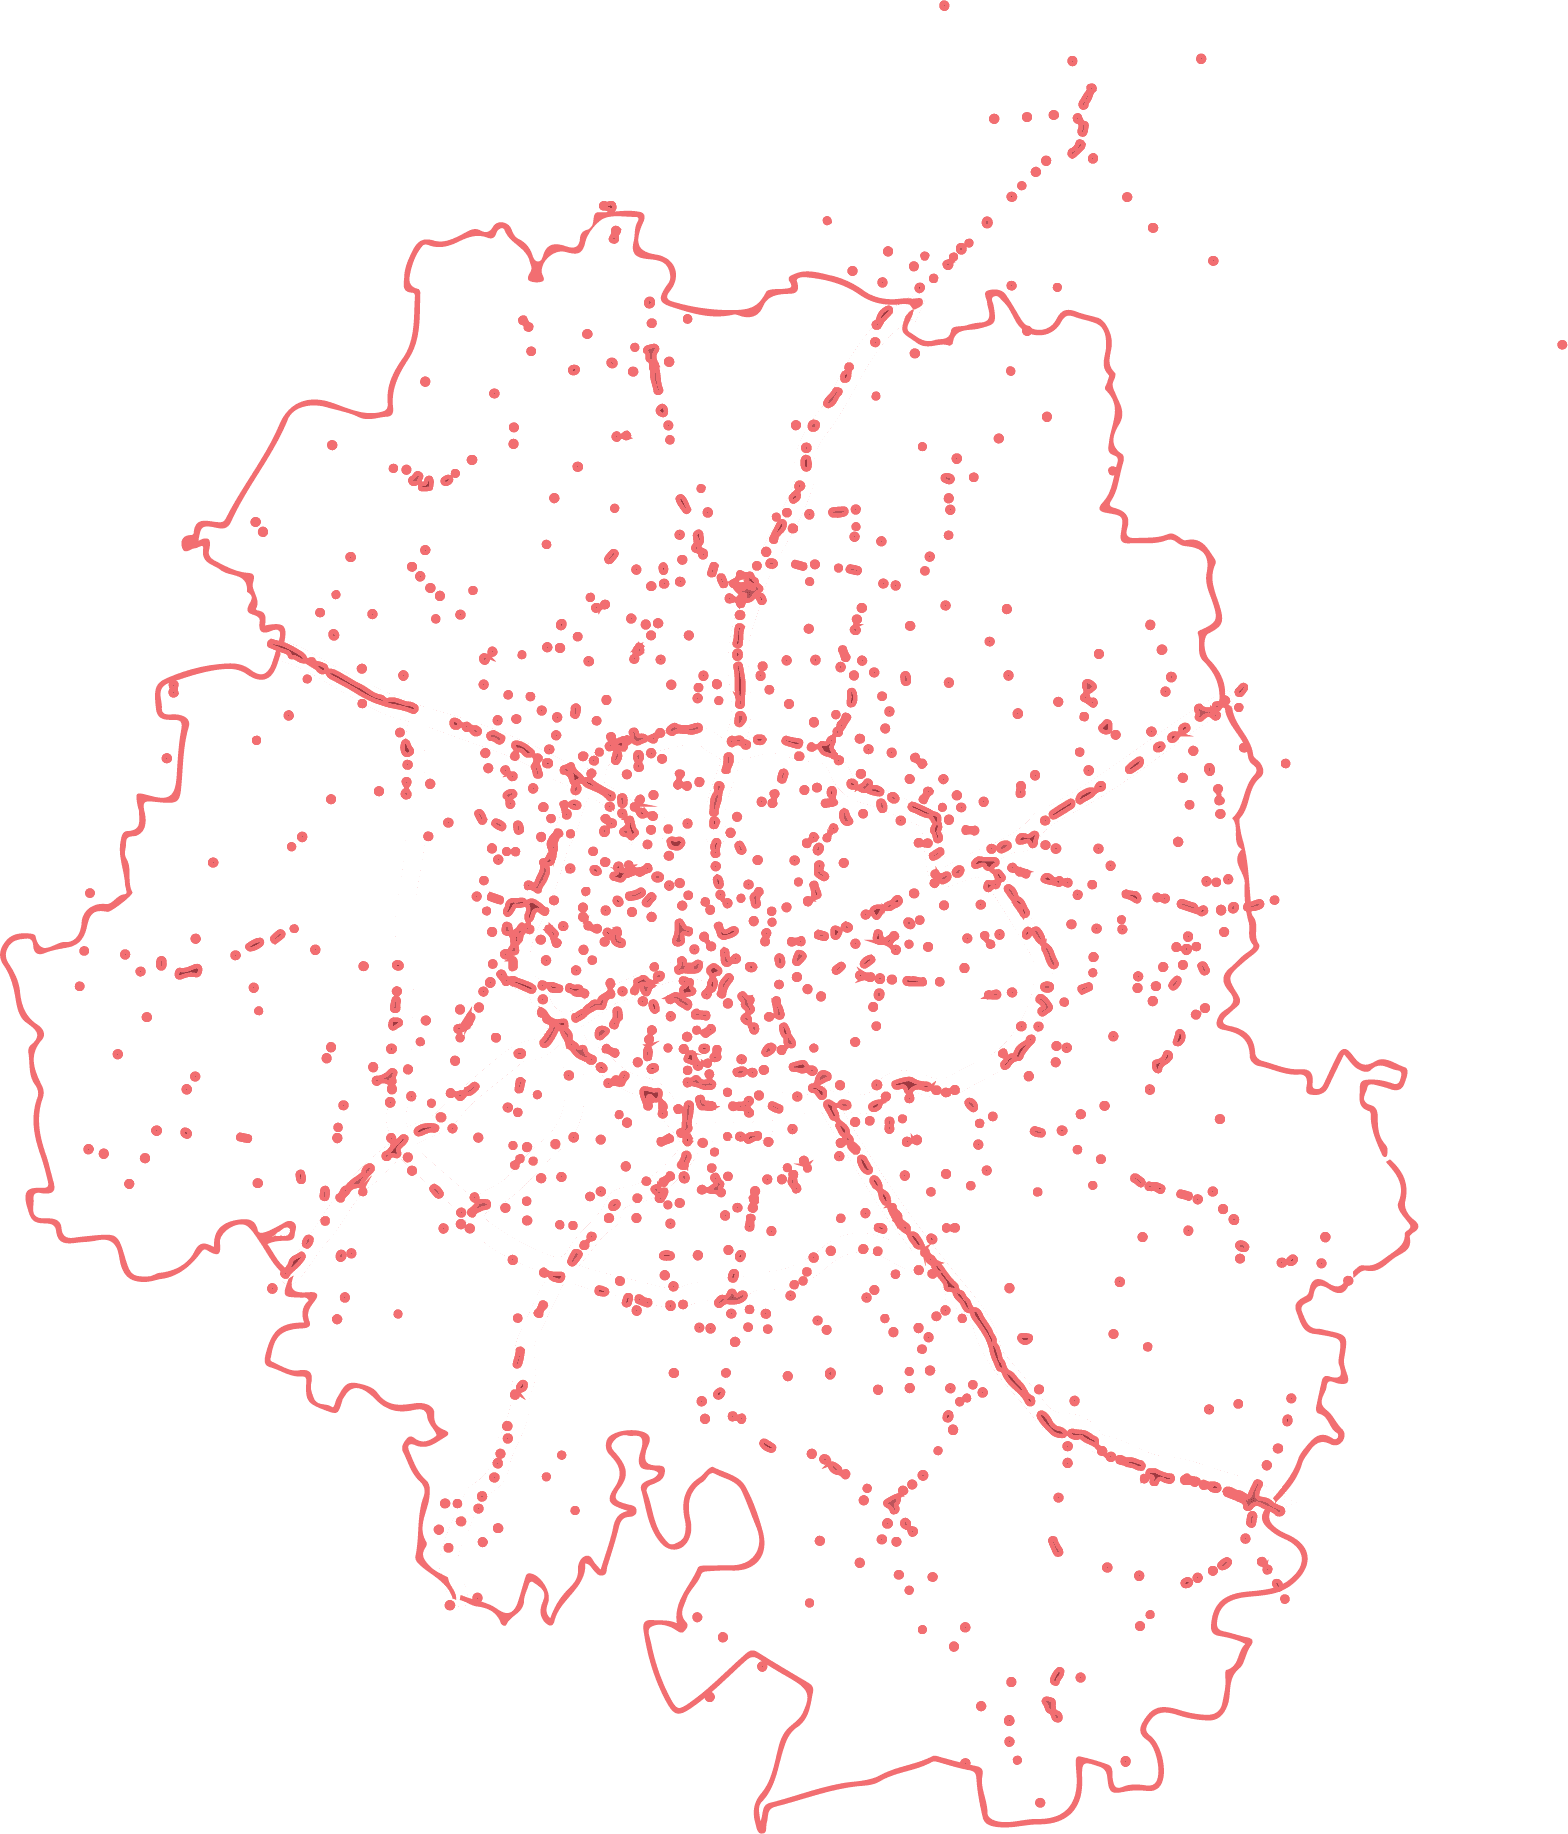
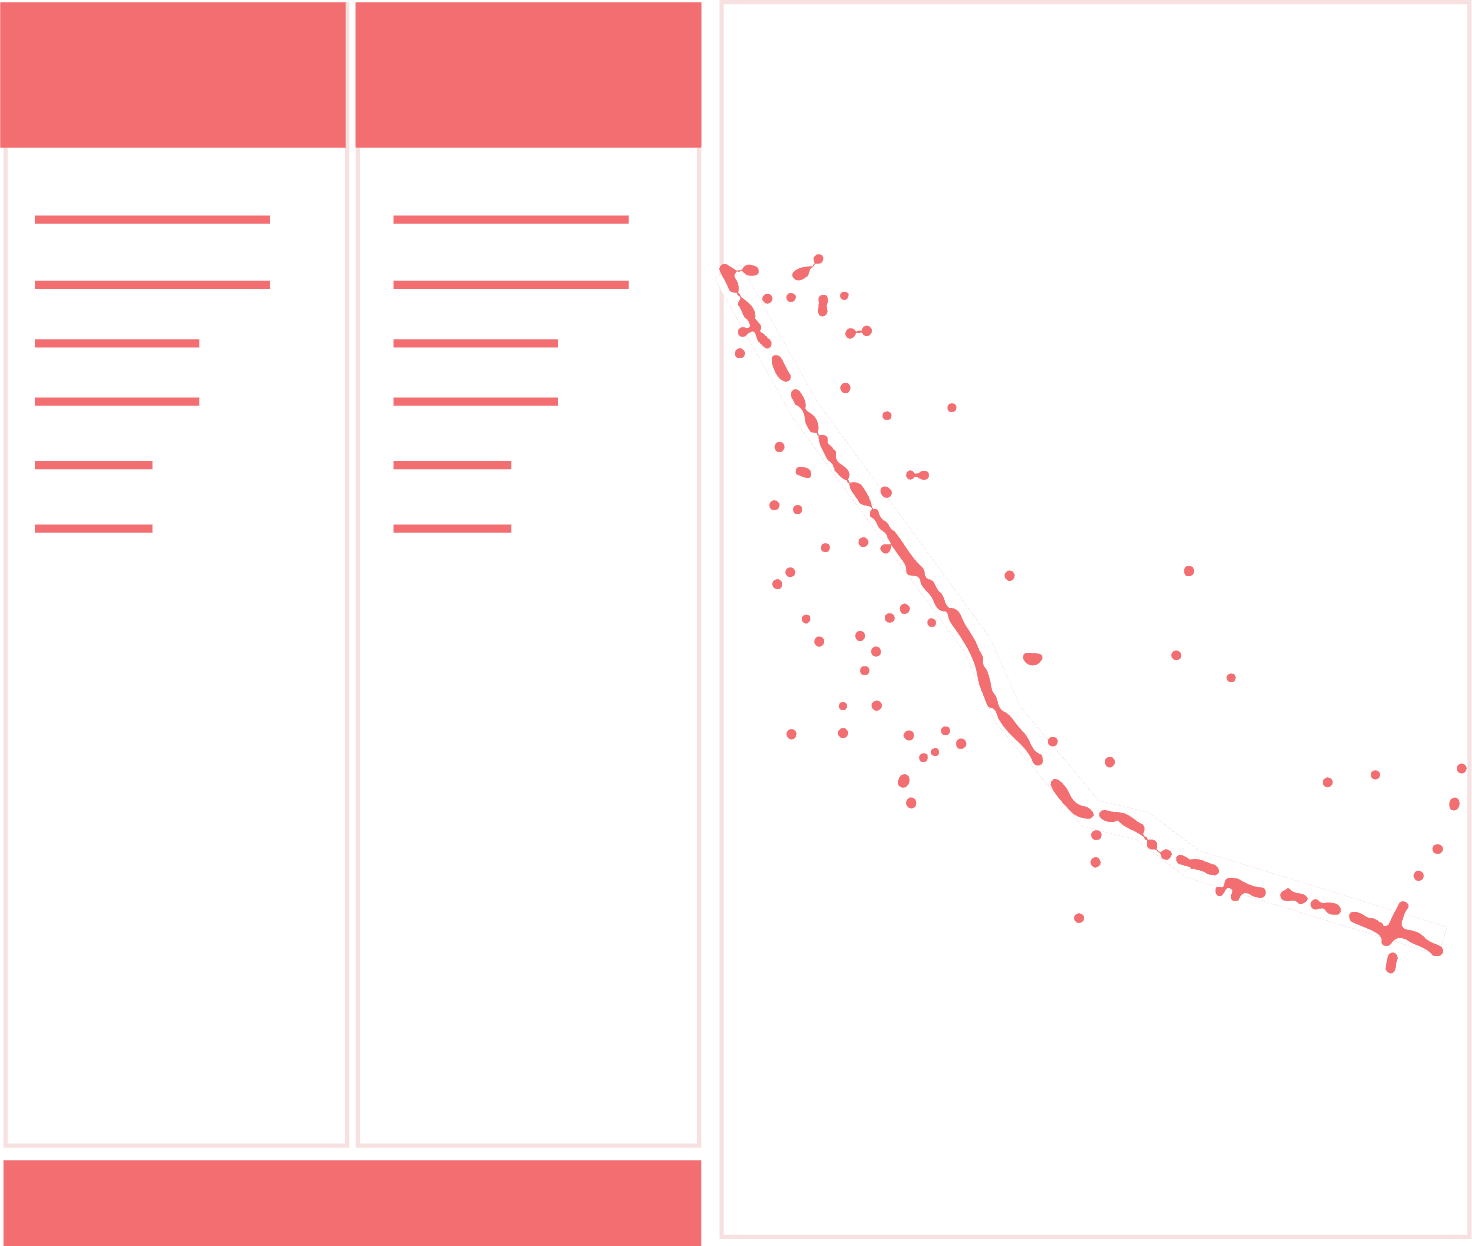
We use crash data to identify the city’s most high-risk locations - junctions and corridors where accidents are concentrated.
COUNTERMEASURE MATRIX

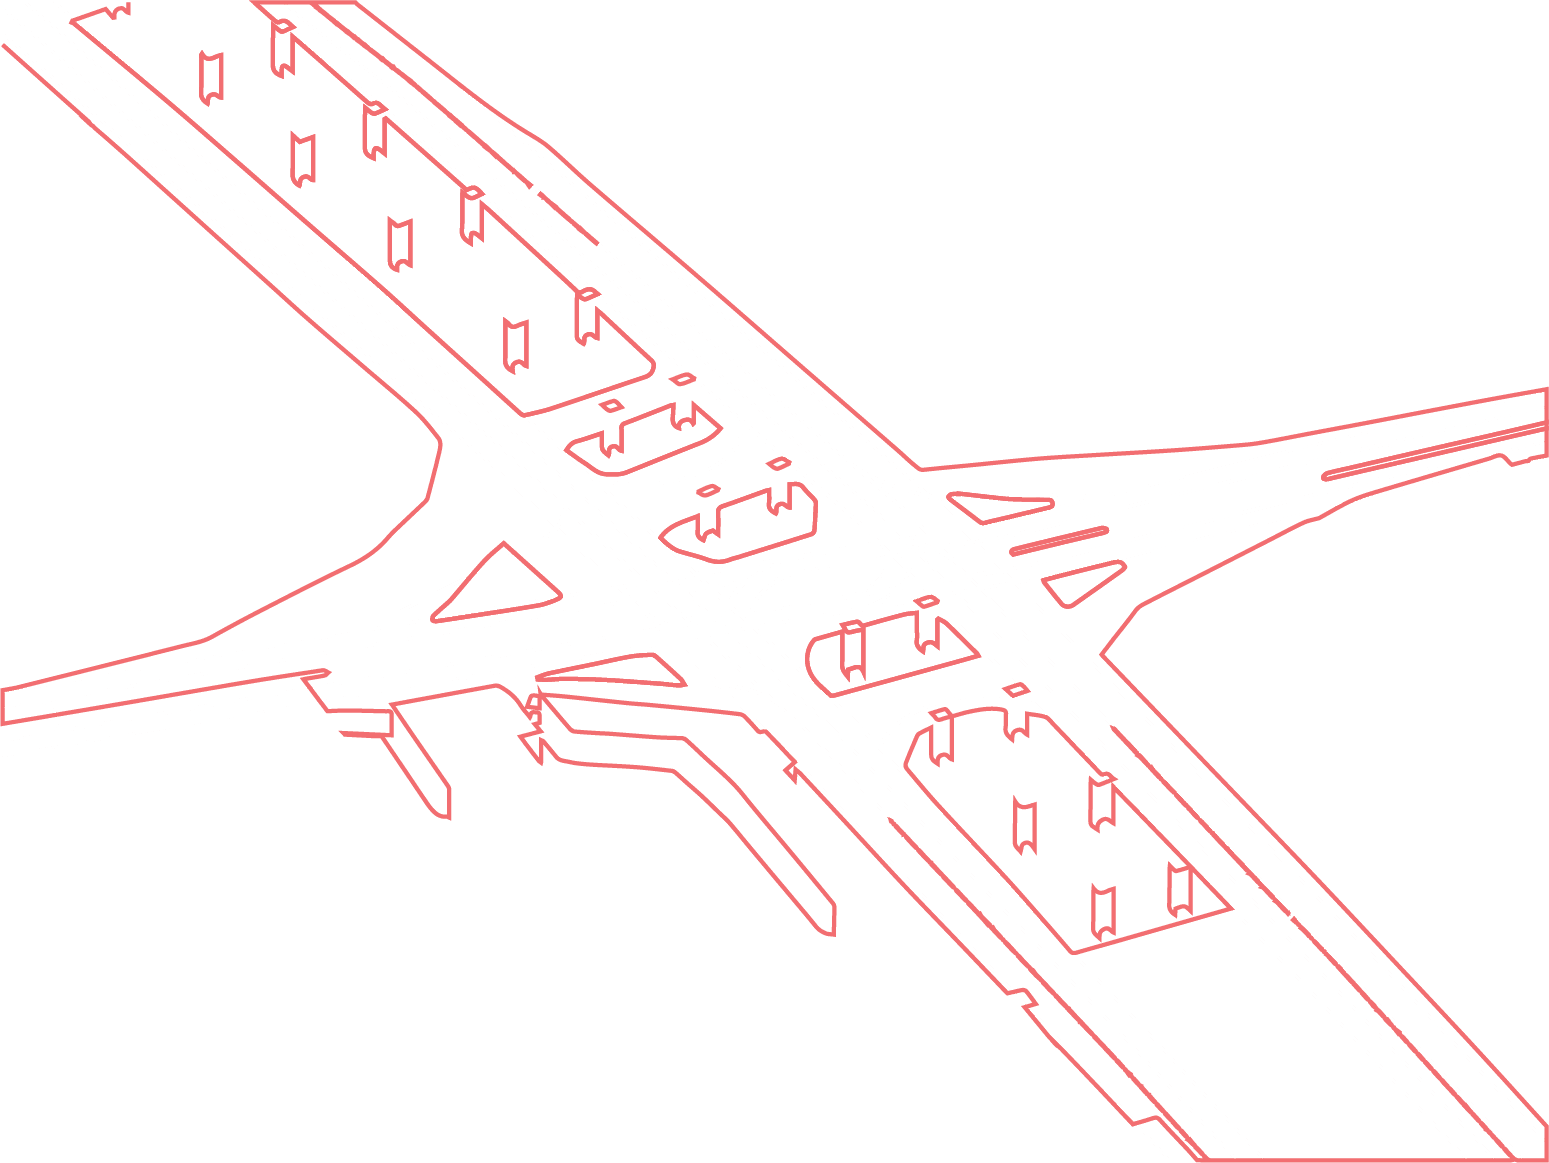
Every high-risk location is mapped to a set of targeted interventions, using a data-derived countermeasure matrix
PUBLIC DASHBOARD

The data and countermeasures are accessible on a dashboard - showing high-risk locations, their risk levels, and recommended interventions.

PROJECT INTERSECT IN THE CITY

What is being done?

Live updates on the Initiative. From data to policy to action on Bengaluru's roads.

MAR 2026

Analysis and identification of locations provided by the Project Intersect Initiative.

Bengaluru’s civic bodies will carry out beautification of 175 junctions.

MAR 2026

Analysis and identification of locations provided by the Project Intersect Initiative.

Bengaluru’s civic bodies will carry out beautification of 175 junctions.

More Updates to Follow

Last Updated Apr 2026

TYPOLOGIES

What kind of High Risk Areas
can you improve?

Five typologies of high risk locations that you can fund, vote and prioritise

TYPOLOGY 01

HIGH PEDESTRIAN FATALITY

Our data identifies locations that report higher numbers of pedestrian fatality.

These locations lack critical pedestrian infrastructure (crossings, footpath, signages, speed reduction) in locations with heavy footfall, around mass transit and in residential areas.

Bengaluru topped the country in number of pedestrian deaths in the last two years.

TYPOLOGY 01

HIGH PEDESTRIAN FATALITY

Our data identifies locations that report higher numbers of pedestrian fatality.

These locations lack critical pedestrian infrastructure (crossings, footpath, signages, speed reduction) in locations with heavy footfall, around mass transit and in residential areas.

Bengaluru topped the country in number of pedestrian deaths in the last two years.

TYPOLOGY 02

UNSAFE INTERSECTIONS

Our data identifies junctions of high priority that record disproportionately high rates of vehicle-to-vehicle and pedestrian collisions.

These locations share common failings - irregular lane markings, sub-optimal signals, and inadequate crossing infrastructure - that make every road user vulnerable.

TYPOLOGY 02

UNSAFE INTERSECTIONS

Our data identifies junctions of high priority that record disproportionately high rates of vehicle-to-vehicle and pedestrian collisions.

These locations share common failings - irregular lane markings, sub-optimal signals, and inadequate crossing infrastructure - that make every road user vulnerable.

TYPOLOGY 03

SCHOOL ZONES

Data indicates that school children face risks during opening (9 am–10 am) and closing hours (3 pm–4 pm).

As most children walk or cycle to schools, the poor pedestrian infrastructure puts them at risk. Children are more vulnerable on Indian roads as their small size restricts their vision and ability to perceive potential threats.

55% OF STUDENTS IN BENGALURU STUDY IN SCHOOLS LOCATED WITHIN 250M OF CRASH-PRONE STREETS (WRI 2021)

TYPOLOGY 03

SCHOOL ZONES

Data indicates that school children face risks during opening (9 am–10 am) and closing hours (3 pm–4 pm).

As most children walk or cycle to schools, the poor pedestrian infrastructure puts them at risk. Children are more vulnerable on Indian roads as their small size restricts their vision and ability to perceive potential threats.

55% OF STUDENTS IN BENGALURU STUDY IN SCHOOLS LOCATED WITHIN 250M OF CRASH-PRONE STREETS (WRI 2021)

TYPOLOGY 04

HIGH SPEED CORRIDORS

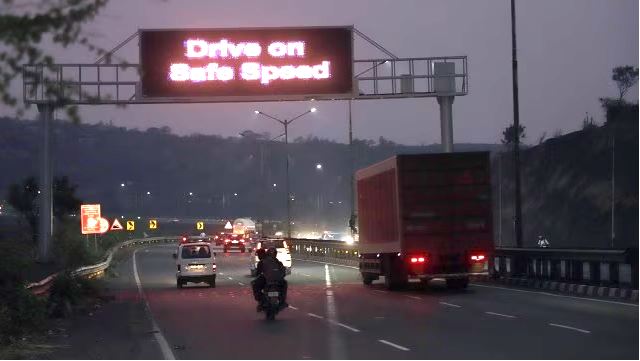
Our data identifies corridors of high priority where speeding is the dominant cause of both pedestrian and vehicle casualties.

Research shows that a five percent reduction in speed can equate to a thirty percent reduction in fatalities, making speed calming interventions among the highest-impact measures available. (BTP Report 2024)

93% of fatalities and 91% of injuries caused in road accidents were attributed to speeding. (BTP 2024)

TYPOLOGY 04

HIGH SPEED CORRIDORS

Our data identifies corridors of high priority where speeding is the dominant cause of both pedestrian and vehicle casualties.

Research shows that a five percent reduction in speed can equate to a thirty percent reduction in fatalities, making speed calming interventions among the highest-impact measures available. (BTP Report 2024)

93% of fatalities and 91% of injuries caused in road accidents were attributed to speeding. (BTP 2024)

TYPOLOGY 05

SIGNAGES & MARKINGS

Find zones where inadequate signage and road markings put all road users at risk.

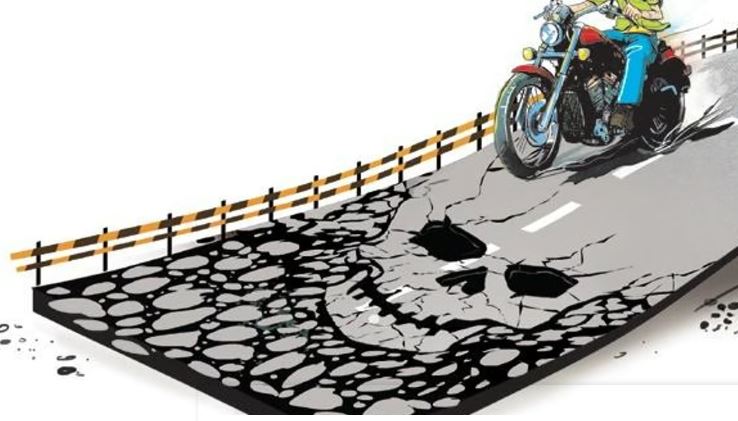
Long stretches of road with unpainted humps, missing lane markings, and limited signage at blind turns create zones that are accident prone.

TYPOLOGY 05

SIGNAGES & MARKINGS

Find zones where inadequate signage and road markings put all road users at risk.

Long stretches of road with unpainted humps, missing lane markings, and limited signage at blind turns create zones that are accident prone.

GET INVOLVED

How can you make Bengaluru's
roads safer?

One Dashboard, Three Ways to Contribute.

Depending on who you are and what you can bring to the problem.

  1. CSR & PHILANTHROPIES

FUND

Choose a junction. Define your impact.

1

Filter blackspots by theme:

Crash Junctions, School Zones, Transit Nodes and more.

2

Set your budget range.

3

Select a junction, analyse the crash data and fund the intervention.

  1. CONCERNED CITIZEN

VOTE

Your Neighborhood. Your Streets.

Your Say.

1

Find your neighborhood on the map and see existing blackspots.

2

Review each junction's crash data and infrastructure gaps

3

Upvote the location

  1. GOVERNMENT OFFICIAL

PRIORITISE

Plan Safer Corridors.

From Wards to Corporations.

1

Filter blackspots by corporation zones.

2

Set budget and review the countermeasure and infrastructure data.

3

Identify gaps and prioritise locations for intervention.

No Login Required

STEPS FOR SOLUTIONING

What countermeasures make a junction safer?

Learn about the design interventions that can make a blackspot safer! These measures will be introduced to high risk zones to improve their safety
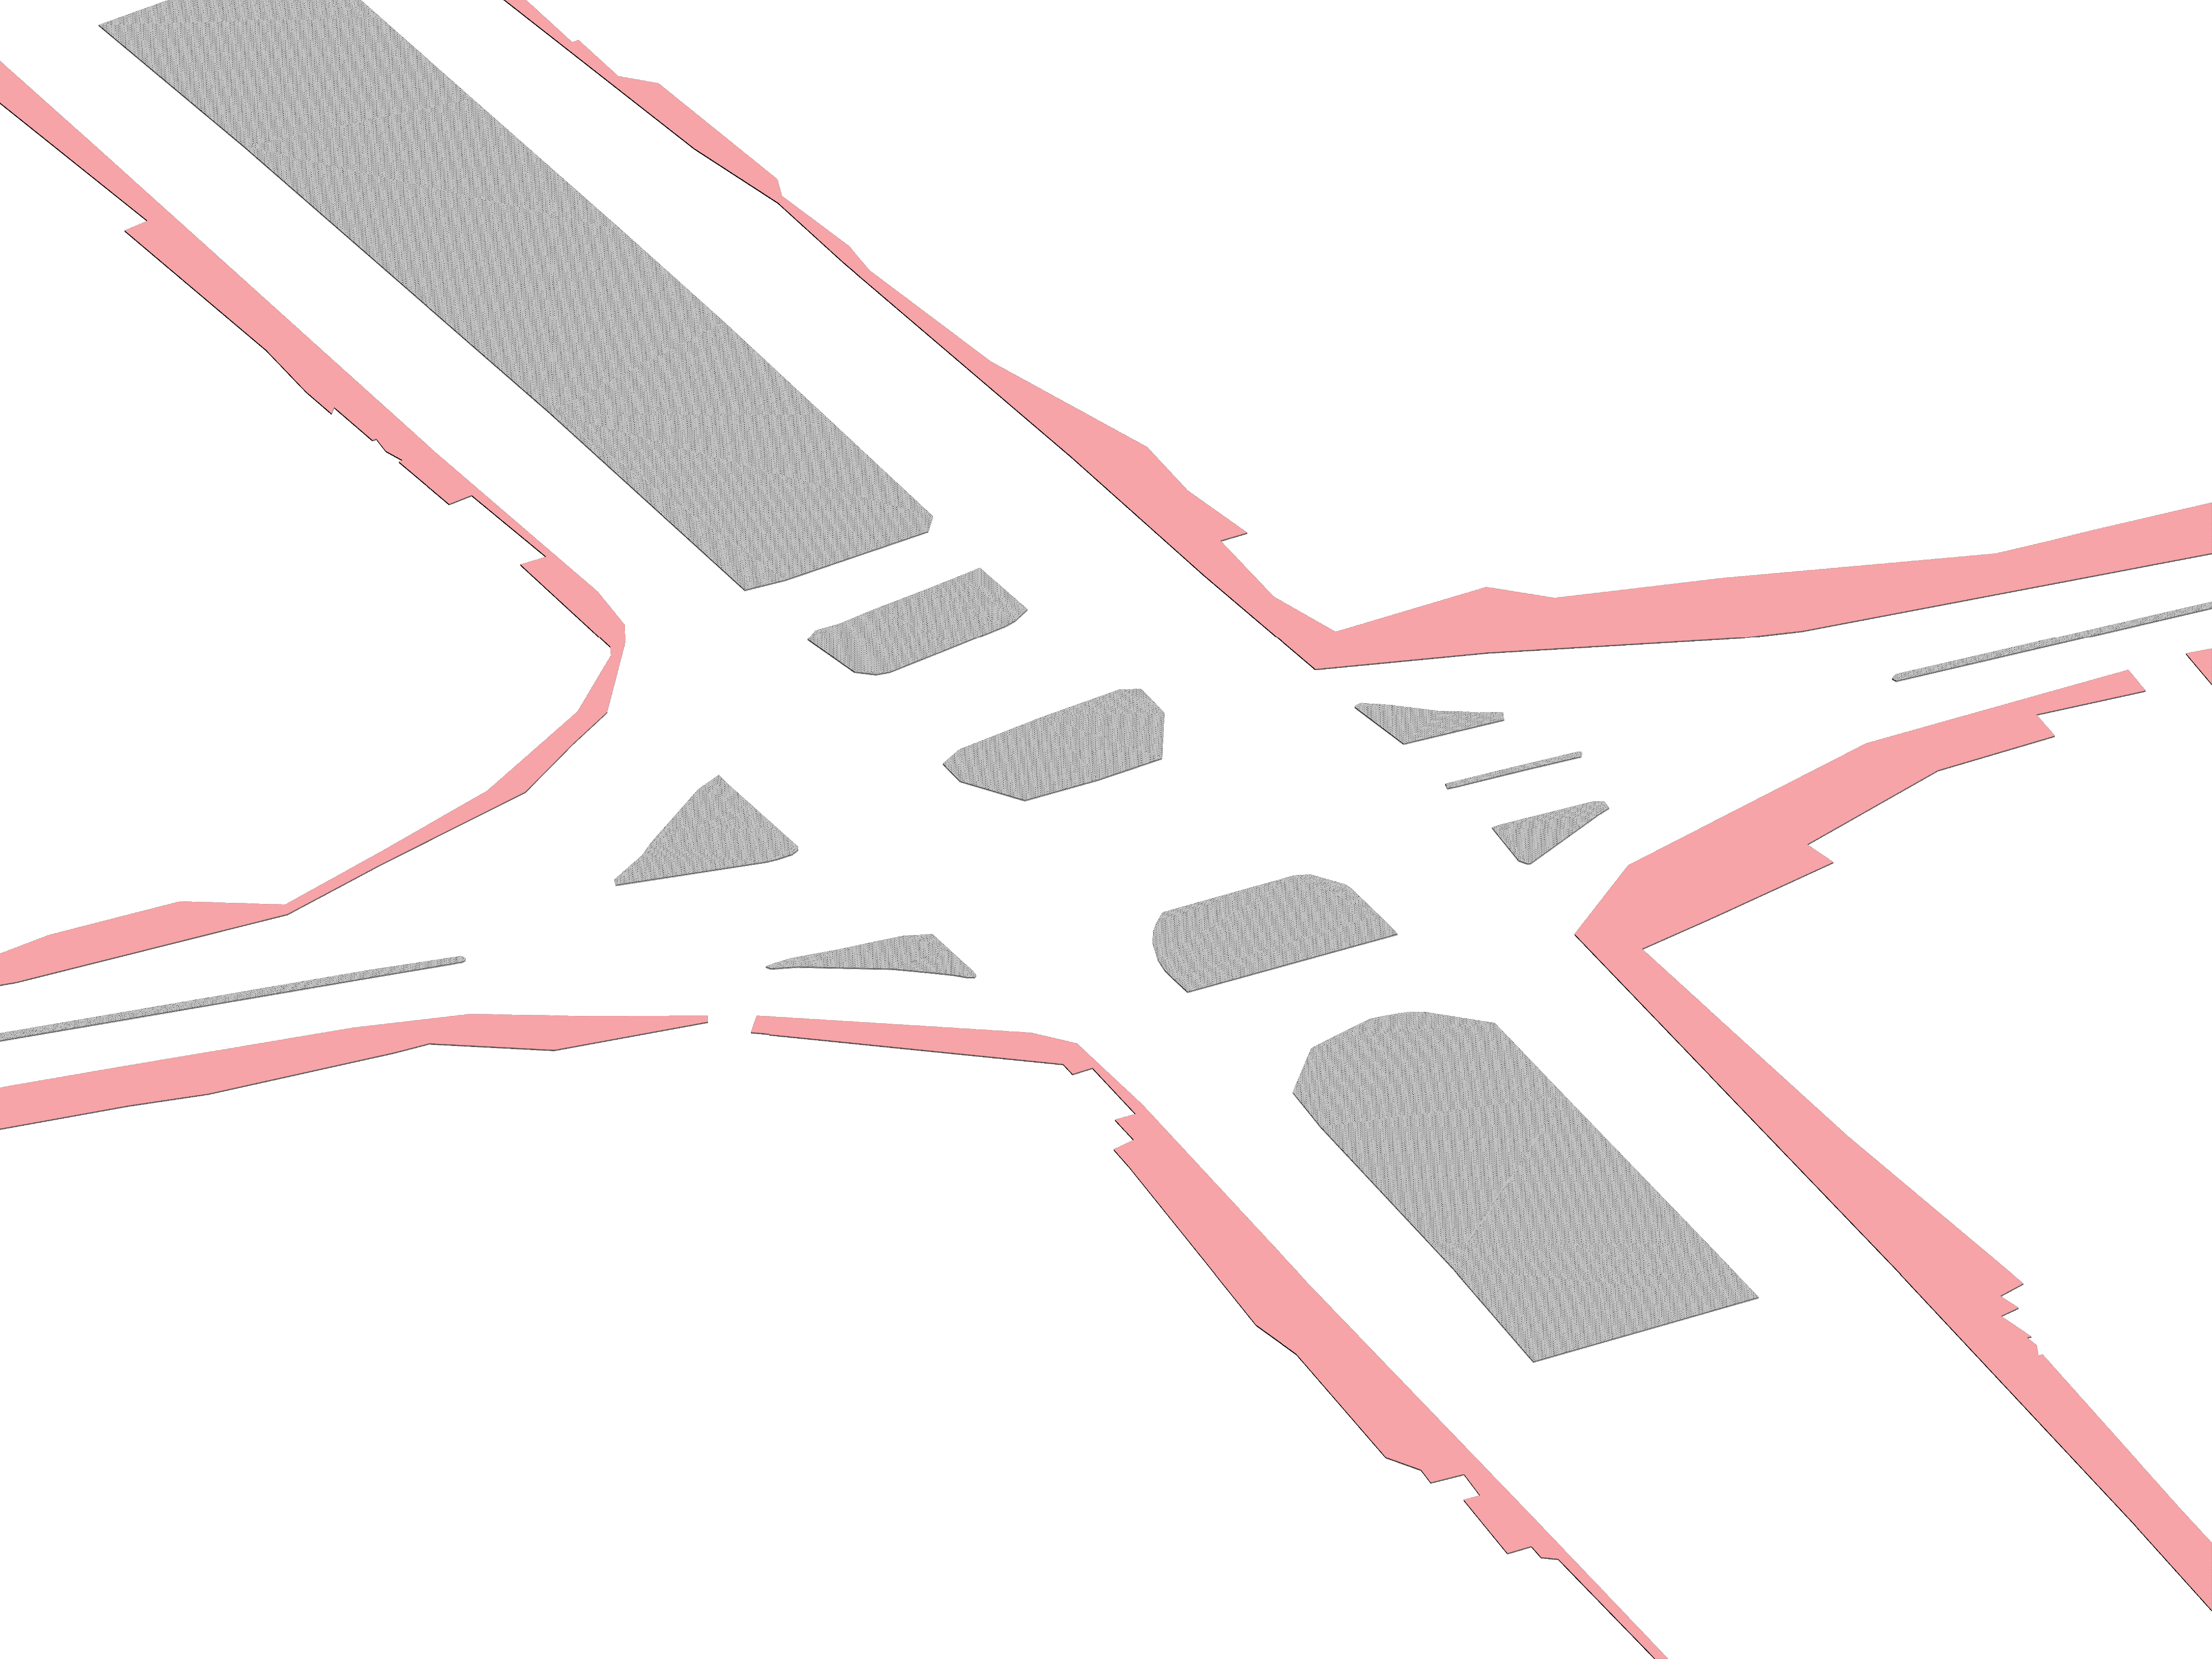
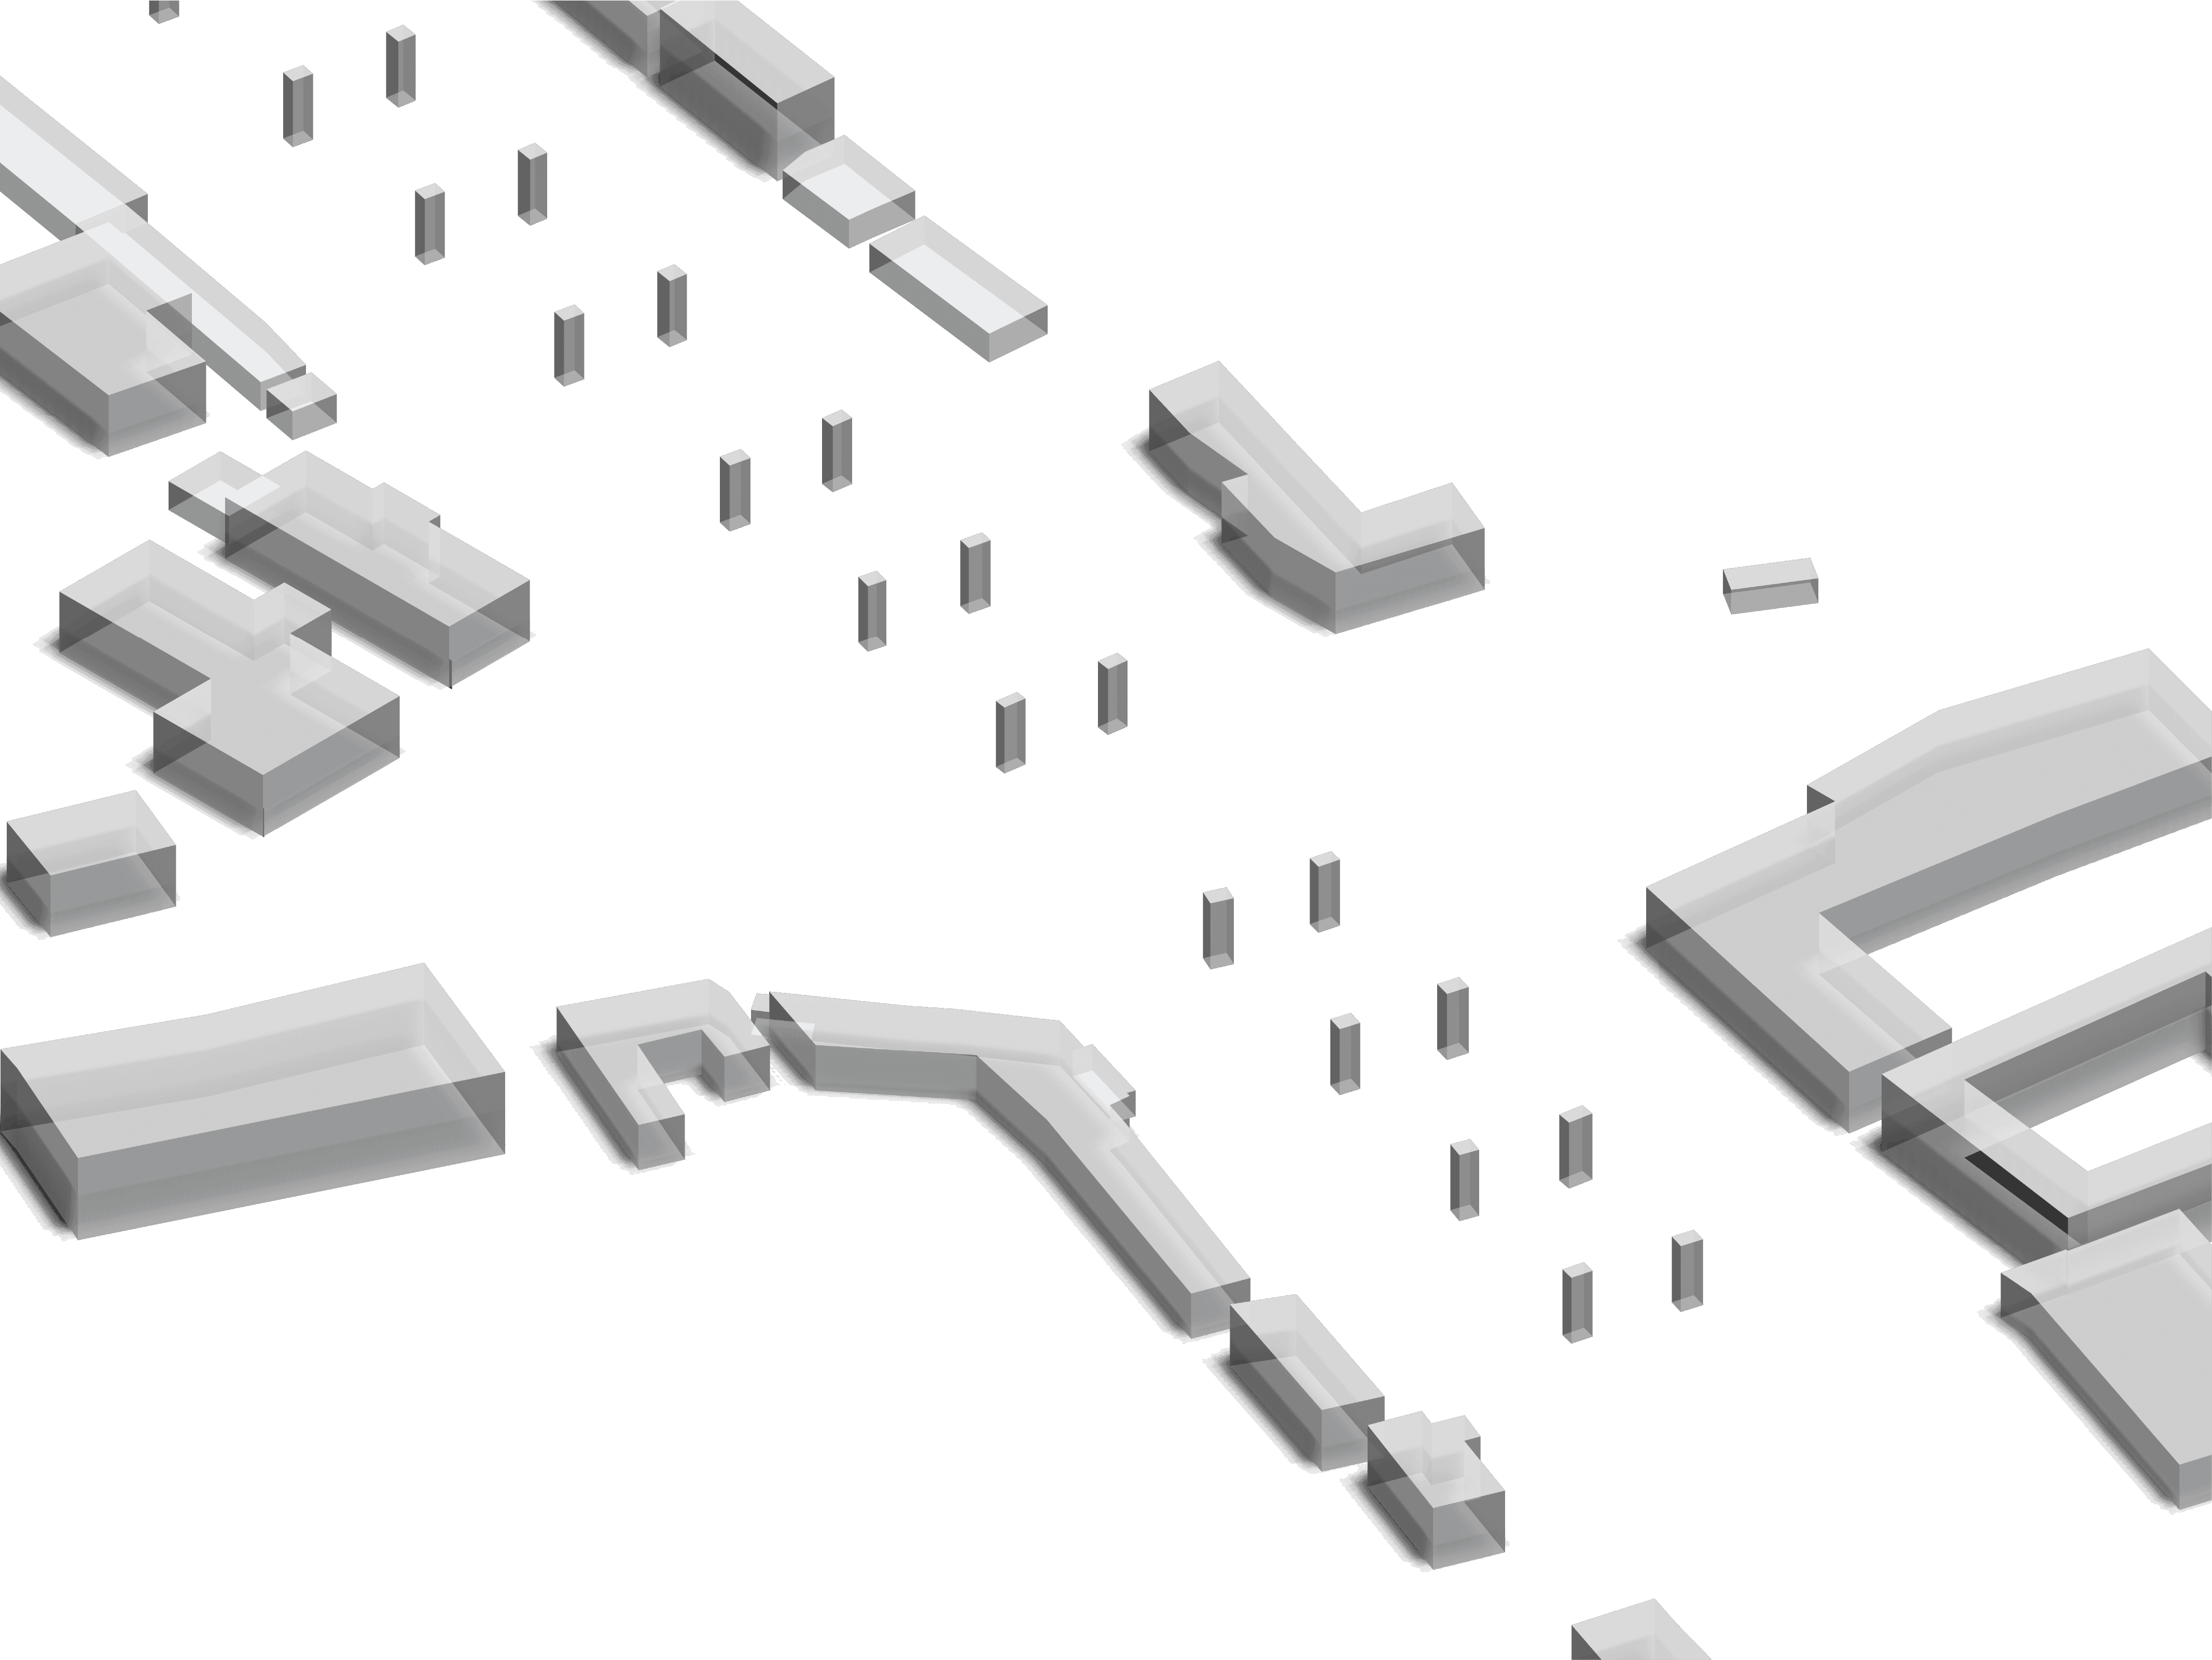
click on the icons to find out!

START
THE EXISTING
START
THE EXISTING
START
THE EXISTING


View on the Desktop to interact with more interesting features!


View on the Desktop to interact with more interesting features!

Latest news on Road Safety

Access the latest news of road safety, in and around Bengaluru, here:

A Data to Impact blueprint for
Road Safety in Bengaluru

Conceptualised and Created By:
Supported by:
Technical Partner:
Conceptualised and Created By:
Supported by:
Technical Partner:

A Data to Impact blueprint for
Road Safety in Bengaluru

Conceptualised and Created By:
Supported by:
Technical Partner: